As we continue a hybrid approach to teaching and learning where much of the collaboration is remote, the search for educational technology tools that best meet this need while fostering course engagement for faculty and students alike is ongoing. One tool that serves to organize discussion threads, Q&As, and additional asynchronous conversation is Ed Discussion.
The Ed Discussion platform is user-friendly, displaying color-coded categories where new threads that contain questions, posts, or announcements are housed for easy access. The interface enables advanced searching and filtering functionality that simplifies the accommodation of large courses containing a number of discussion posts. The image below shows the default Ed Discussion page as linked from the tab in your Canvas course site:
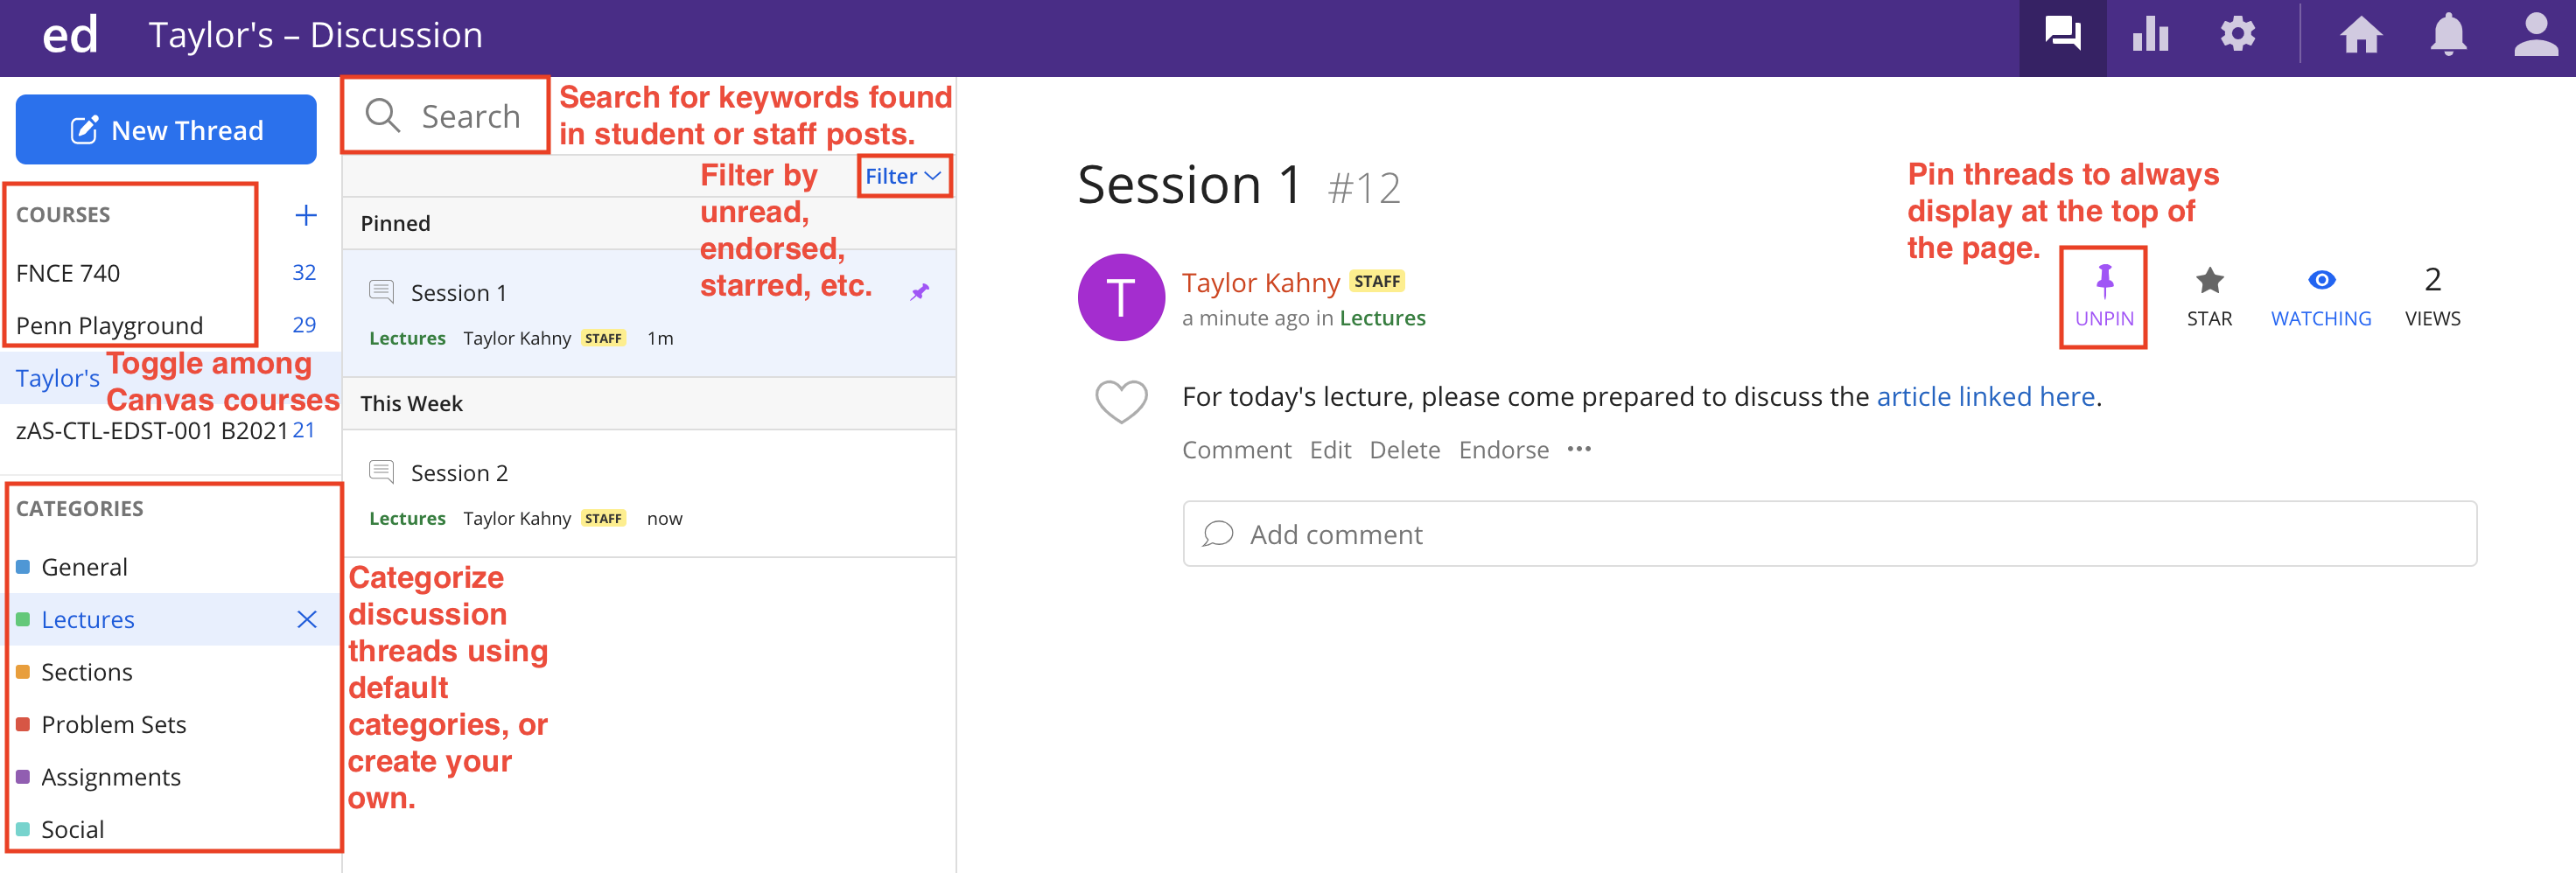 In terms of teaching team communication, the platform also enables private discussion threads where professors, teaching assistants, and other course staff can easily communicate in a separate back-channel that is hidden from students. Instructors can also @ mention each other (and students in other channels) to notify the users of updated activity.
When crafting a new thread, similar to the rich content text editor found in Canvas and other familiar platforms, Ed Discussion supports document and image upload, embedded video, megathreads and anonymous posting, LaTeX, image annotation, instructor endorsements, and runnable code snippets. Click here to learn more about the text editor.
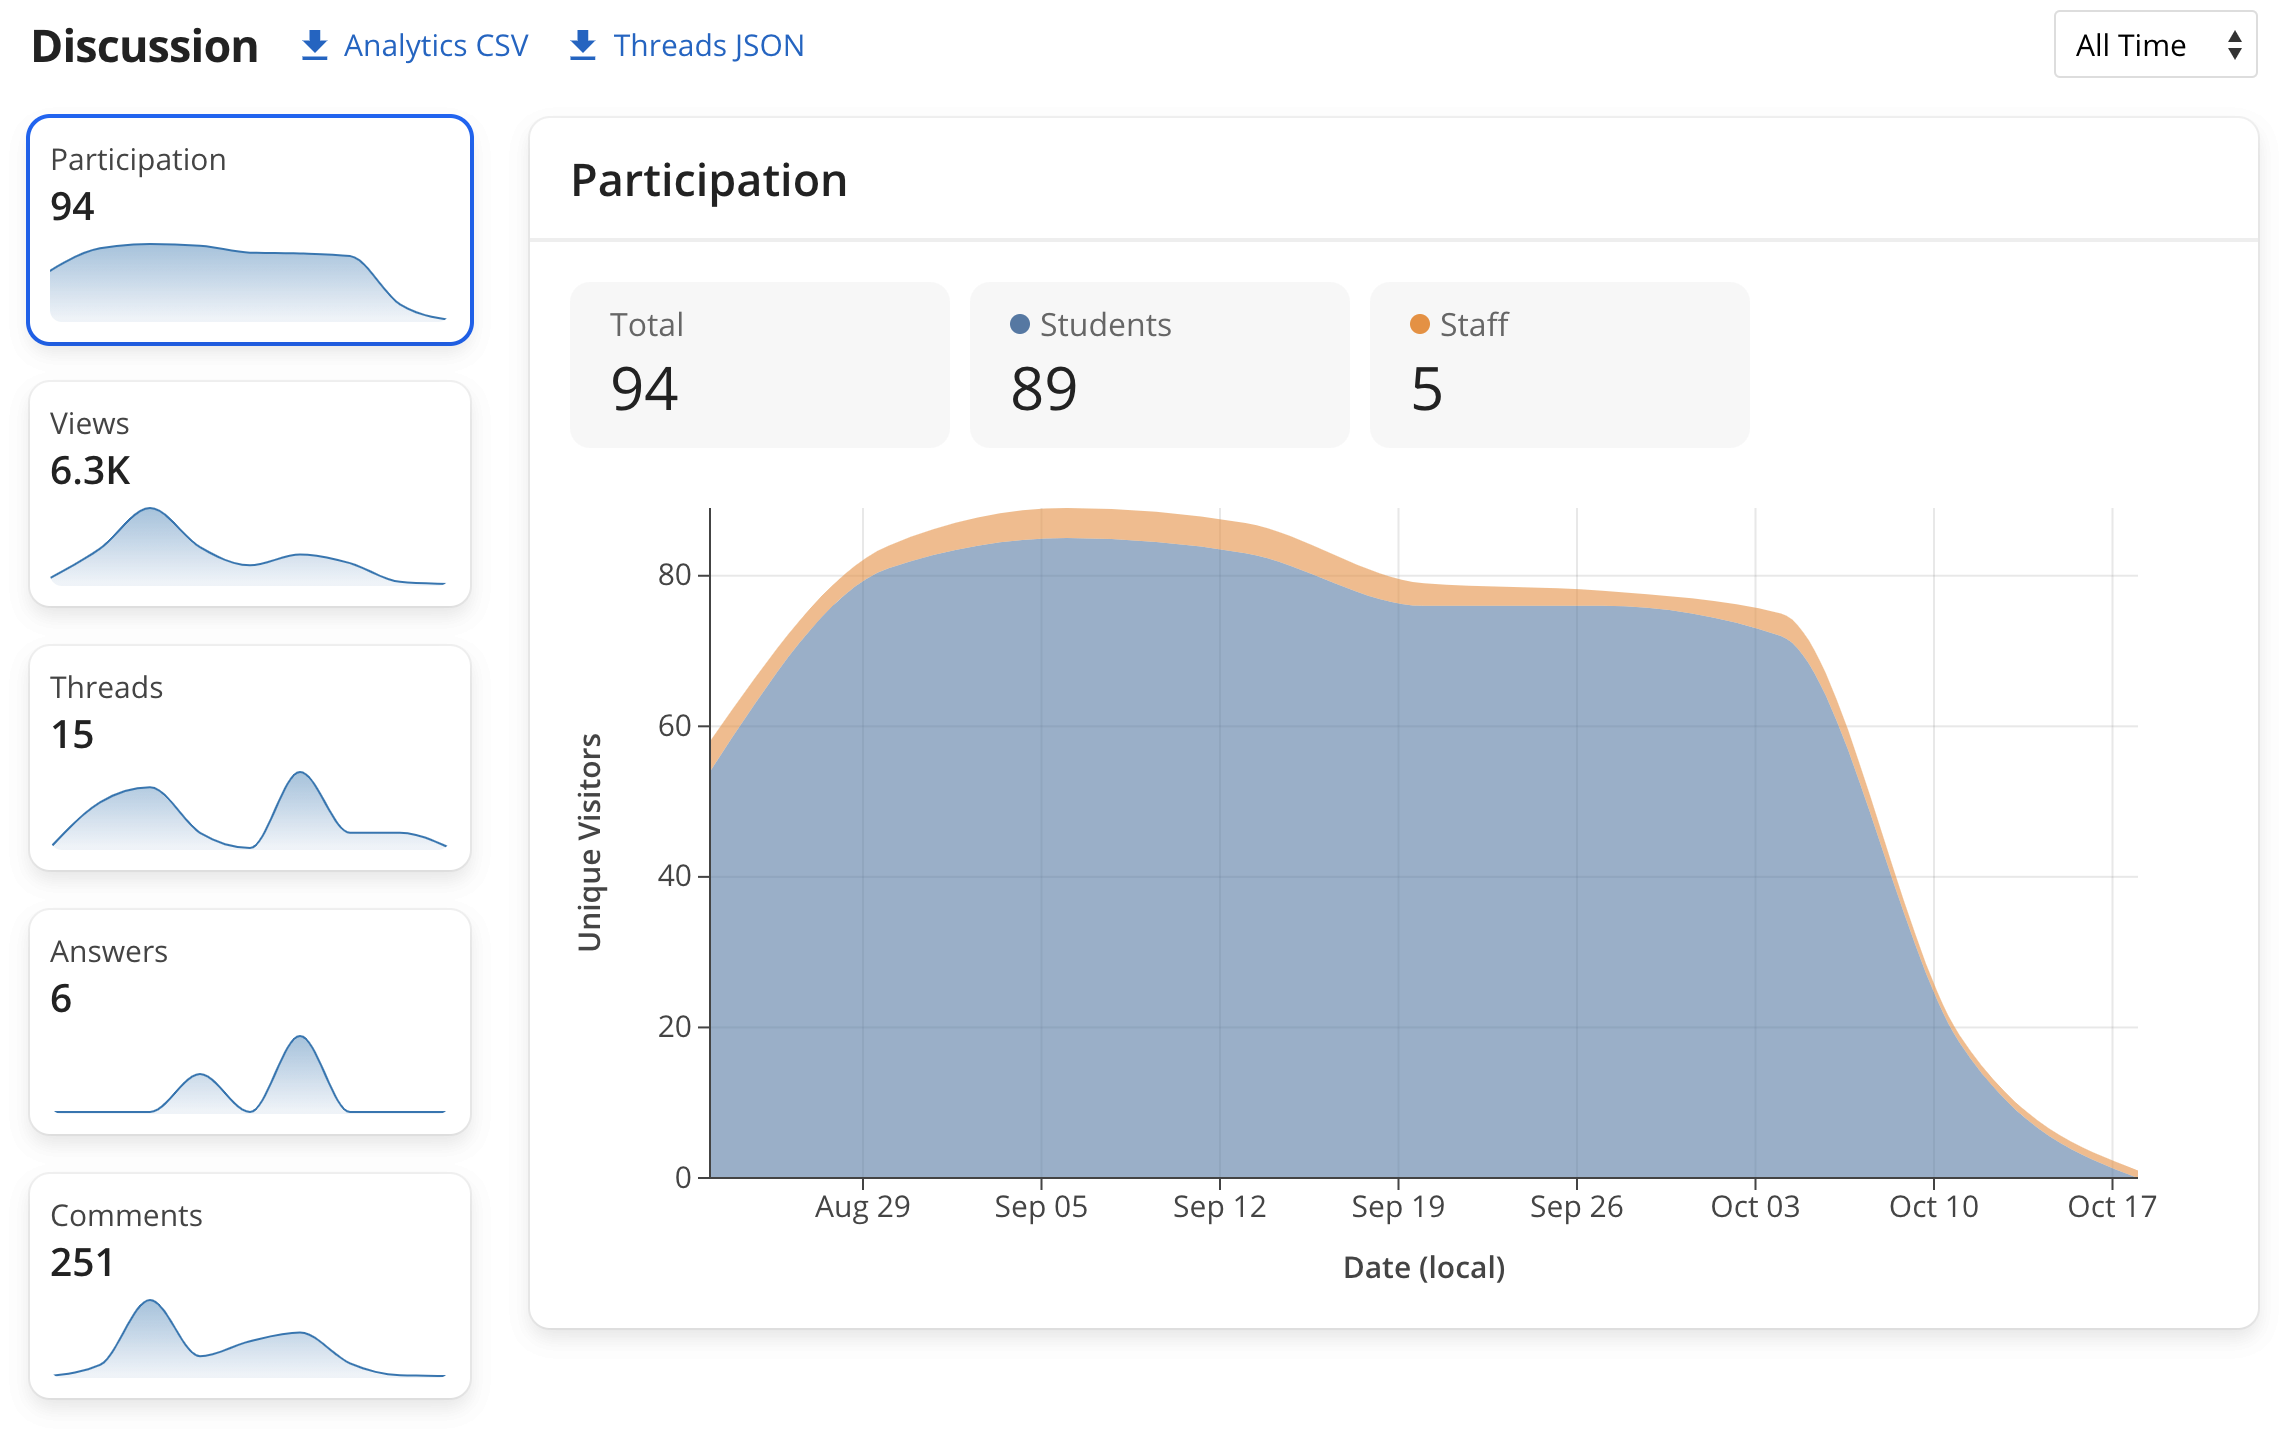
The tool also displays an Analytics section for instructors to access student-specific data regarding top contributors, views, threads, answers, comments, and more. These stats can then be downloaded and viewed in .csv format for further drill-down capabilities such as user email addresses, roles, and specific activity metrics. The images below show how these metrics appear from your Analytics tab:
If you have additional questions or would like to integrate this with your course, please contact courseware@wharton.upenn.edu.